Americans are attending college in ever increasing numbers. An estimated 20 million students are expected to attend college or university immediately following high school graduation, as of fall 2017, which represents an increase of 5 million since 2000.
This project seeks to classify whether a college is private or public based on predictor variables including out of state tuition, acceptance rate, percentage of incoming freshman class that were in the top 10% of their high school class, etc. There are therefore two classes—and two levels—of the response variable. The factors listed below may considered by a college applicant in his or her college search.
Because the choice of attending either a public or private university is influenced by several factors, this project may provide assistance to those seeking to decide by assessing how much a certain university conforms to the typical, expected characteristics of a private or public university.
Pre-processing↗
For all the classification methods, a training set was created using 80% of the original data set while a portion of the data set was reserved as a test set to see how the data would respond to new information, as shown. The original, full data set consisted of 777 colleges, so a split of 80% would yield a training set and test set of 622 and 155 colleges, respectively. These quantities would both yield acceptable sample sizes, with a larger training set for the purpose of creating more refined models.
Decision trees↗
Decision trees separate data by explanatory variables to generate subsets of the data that are distinct to one another, but internally similar. In other words, decision trees generate homogeneous groups with maximized heterogeneity between them.
One term used frequently in the discussion of trees is ‘pruning,’ or the removal of sub-nodes from their respective decision nodes. Low pruning can result in overfitting, while high pruning will lead to large variance, as reflected by less homogeneous groups at each node.
We decided to use decisions trees first in the production of this report, so that we may find the most influential variables for future classification models, a feature of ‘random bagging.’
A general tree model is provided below.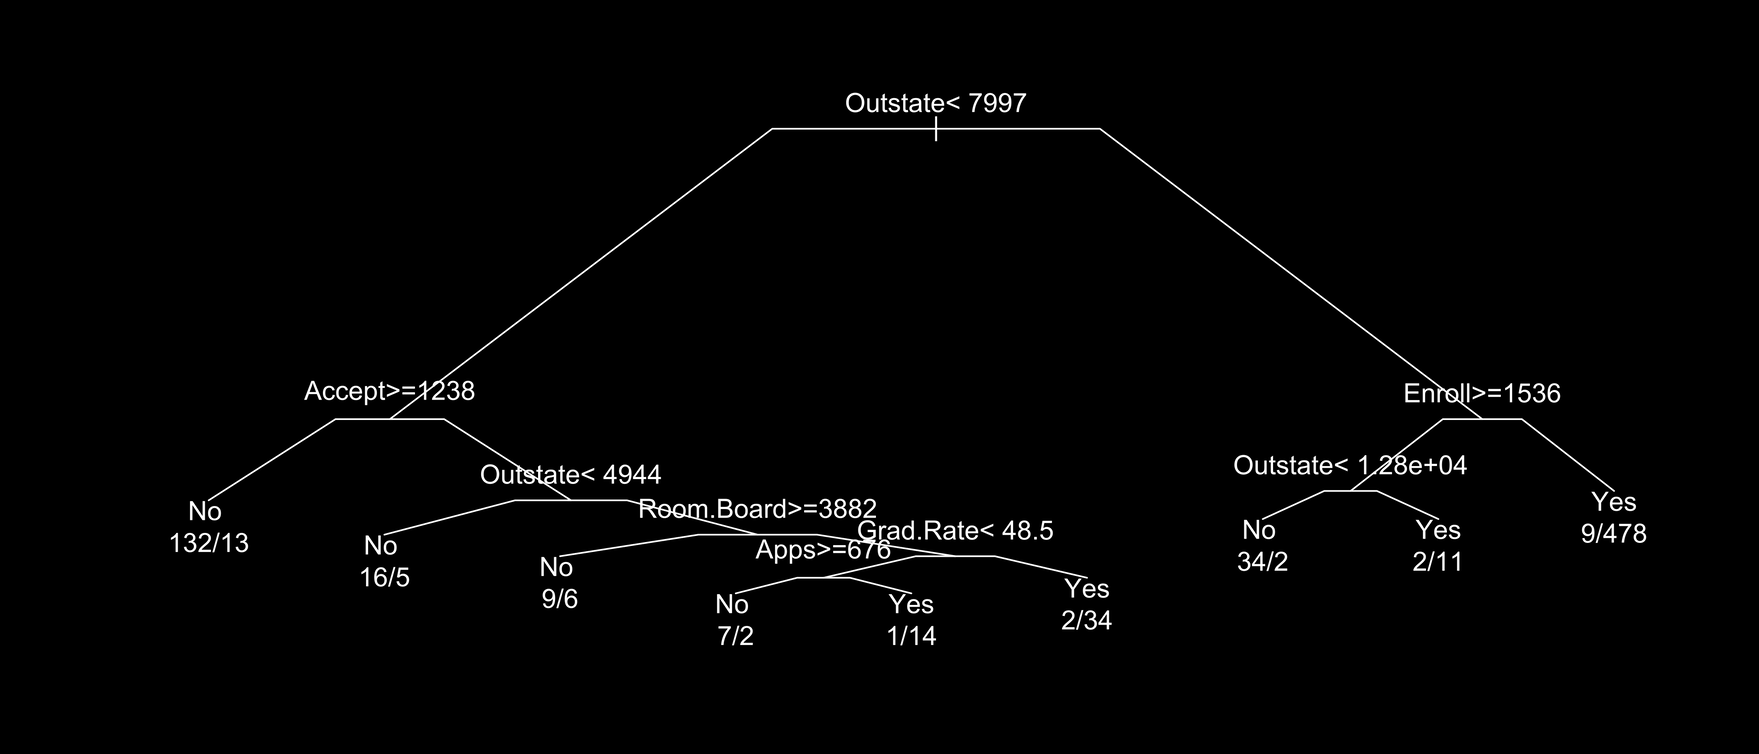
Another tree was generated using this lower (less pruning) setting, shown below.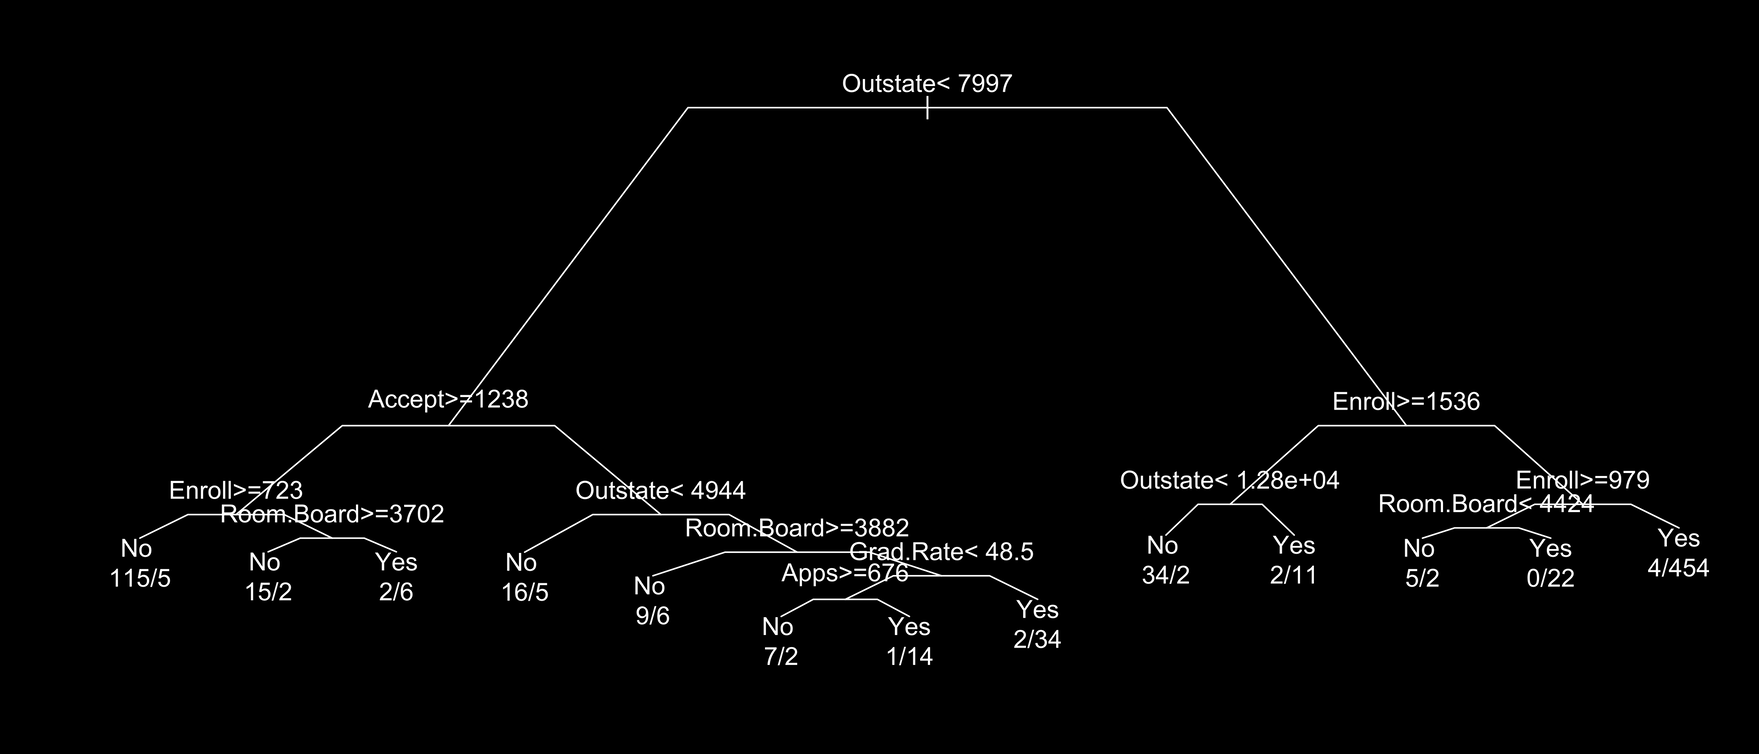
An important component of trees is random forest, which helps determine which variables have the most impact on the data.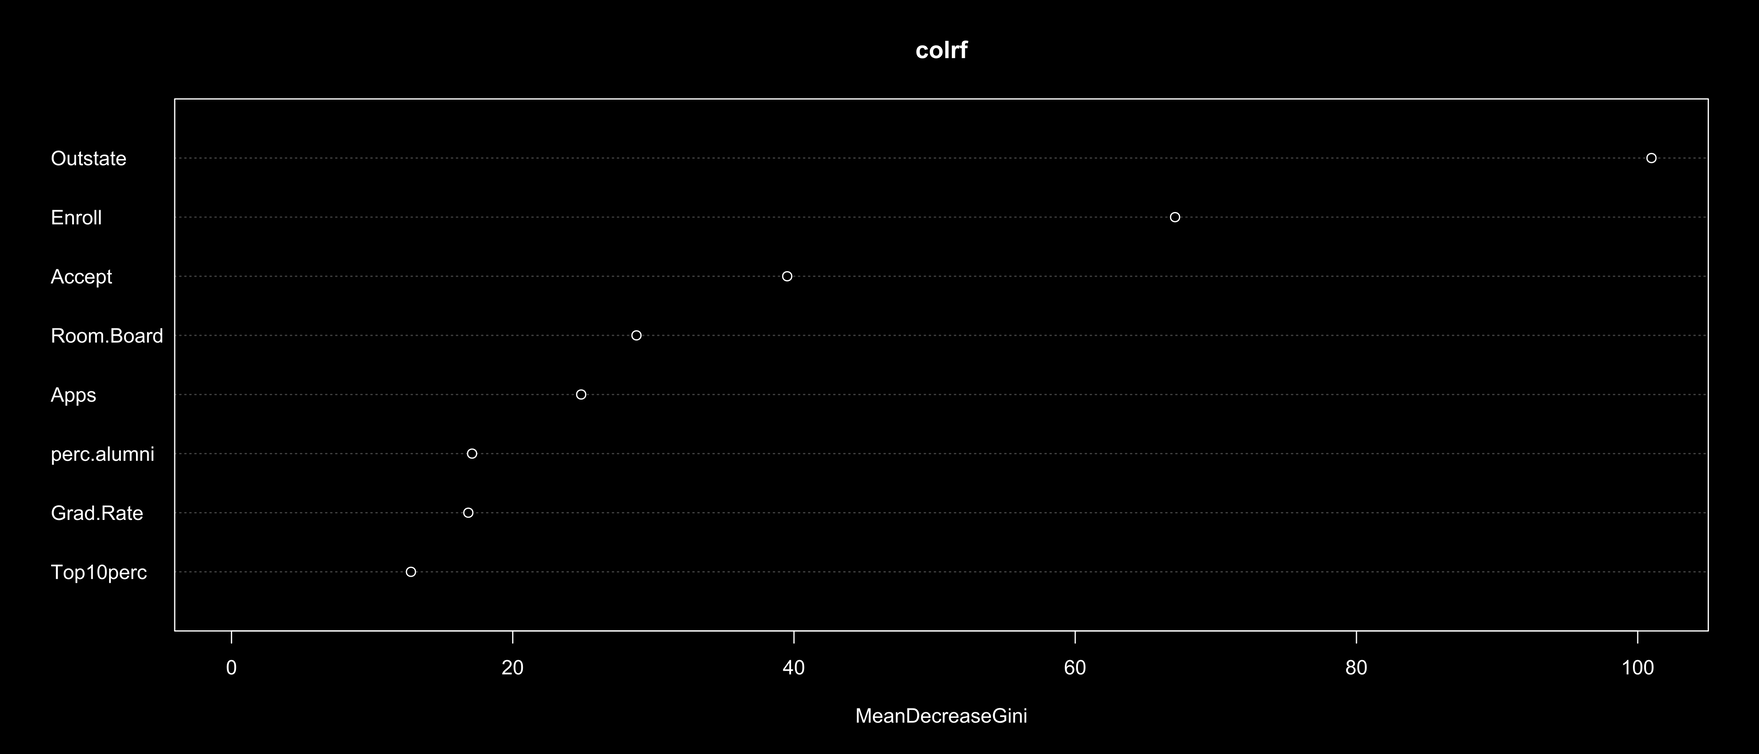
Linear discriminant analysis↗
Linear discriminant analysis maximizes separability between a ‘k’ number of classes via dimension reduction. In our case, this means two classes: private and public colleges.
Linear discriminant analysis will maximize the distance between the means of each class while minimizing the variation within each class. So long as a minimum of two classes are involved, this process works.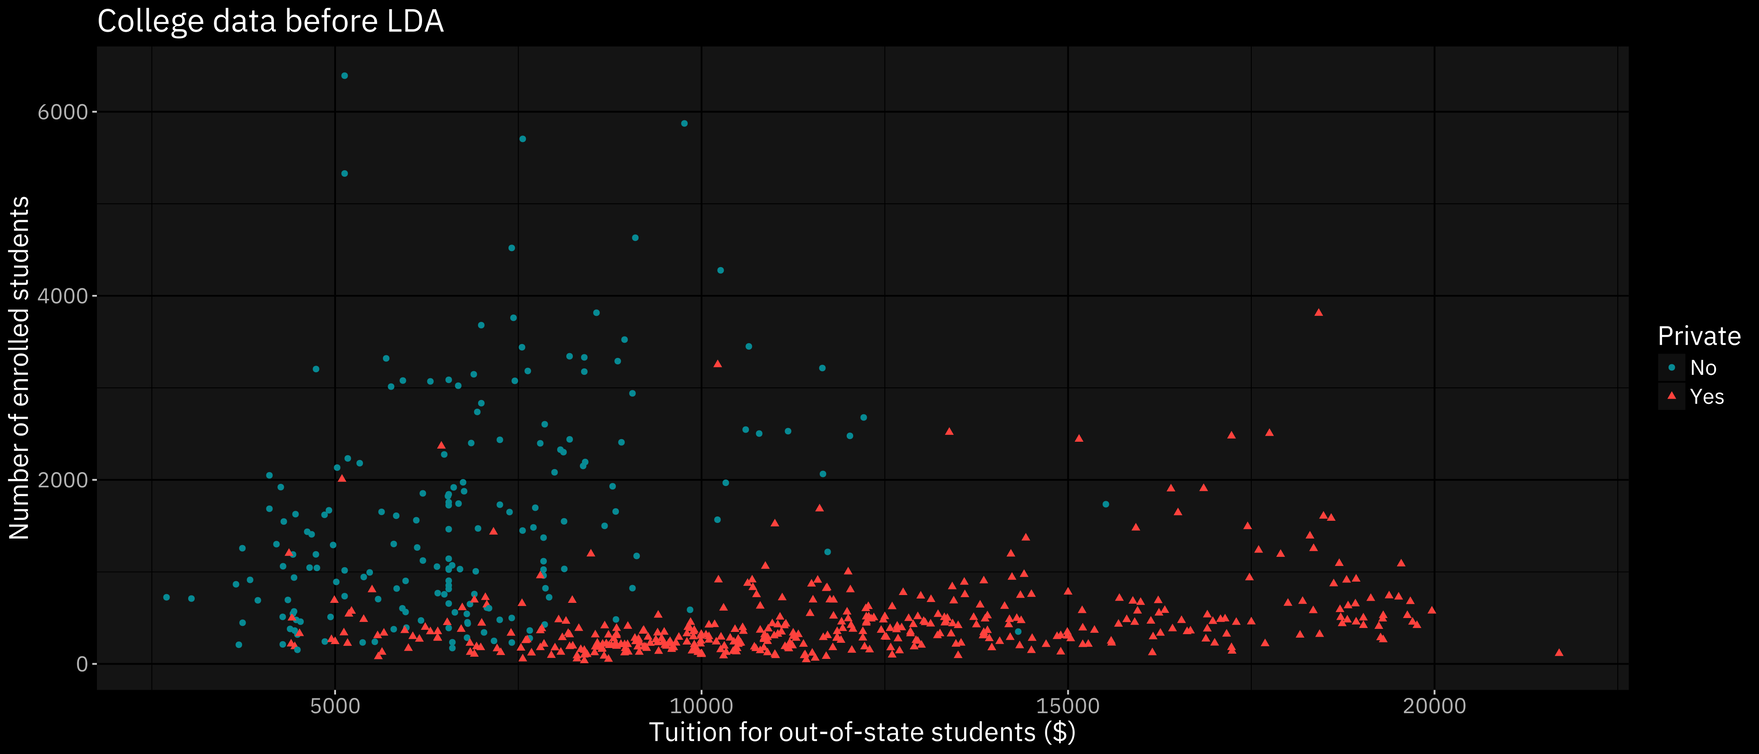
Our training error was 0.093, which is fairly accurate. Consider that random guessing would yield a training error of 0.50.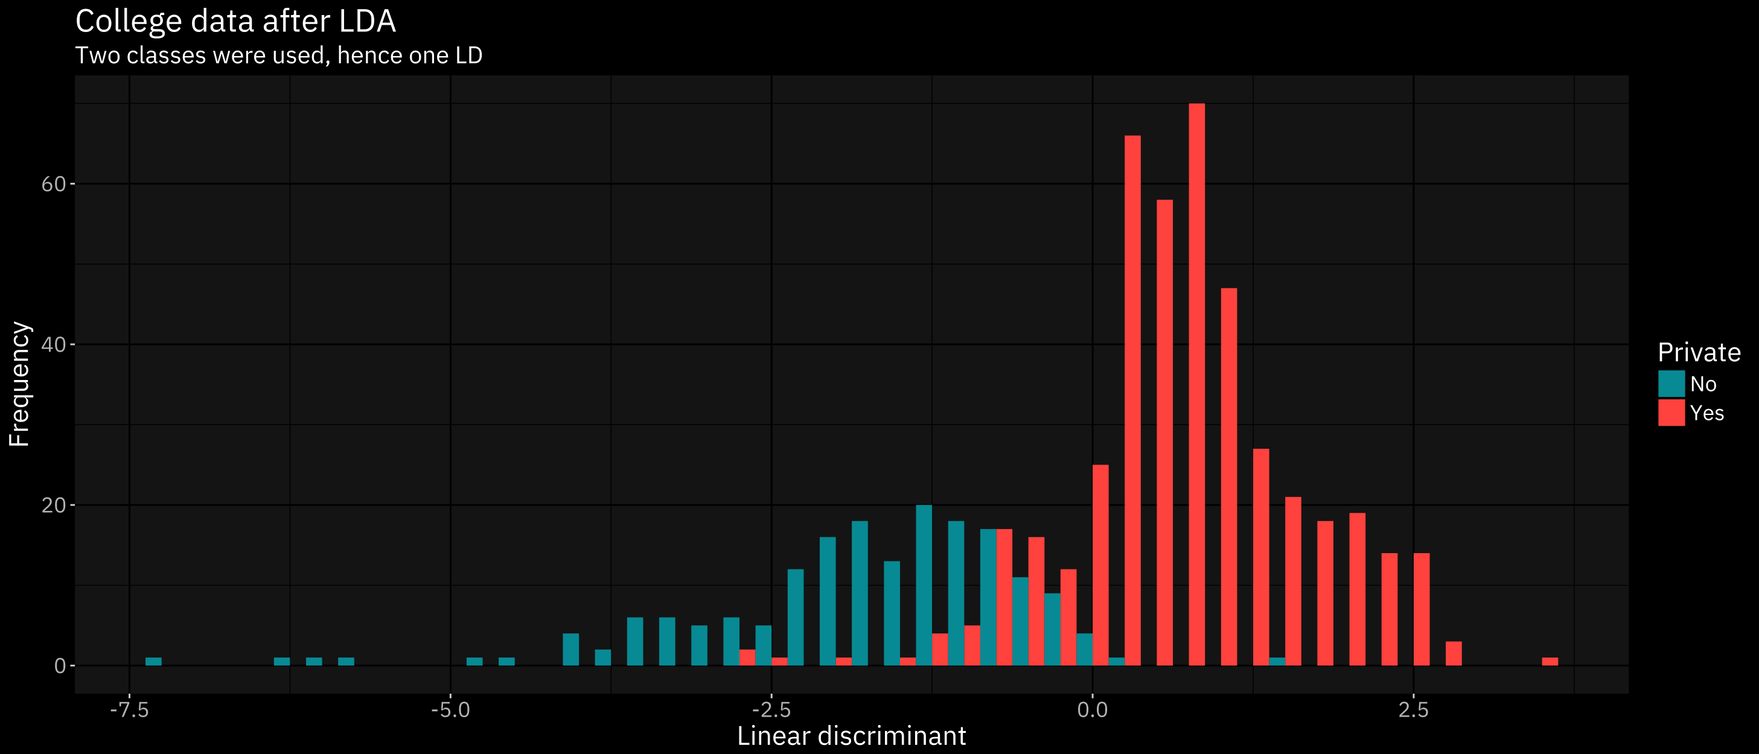
K-nearest neighbor↗
K-nearest neighbor classifies the sample’s response variable based on what the closest point is classified as. So, essentially, the training set is used to create a model of space closest to a certain point. The test set is then applied to the model. The training set point that is closest to the test set point will be classified the same. The test error is .096.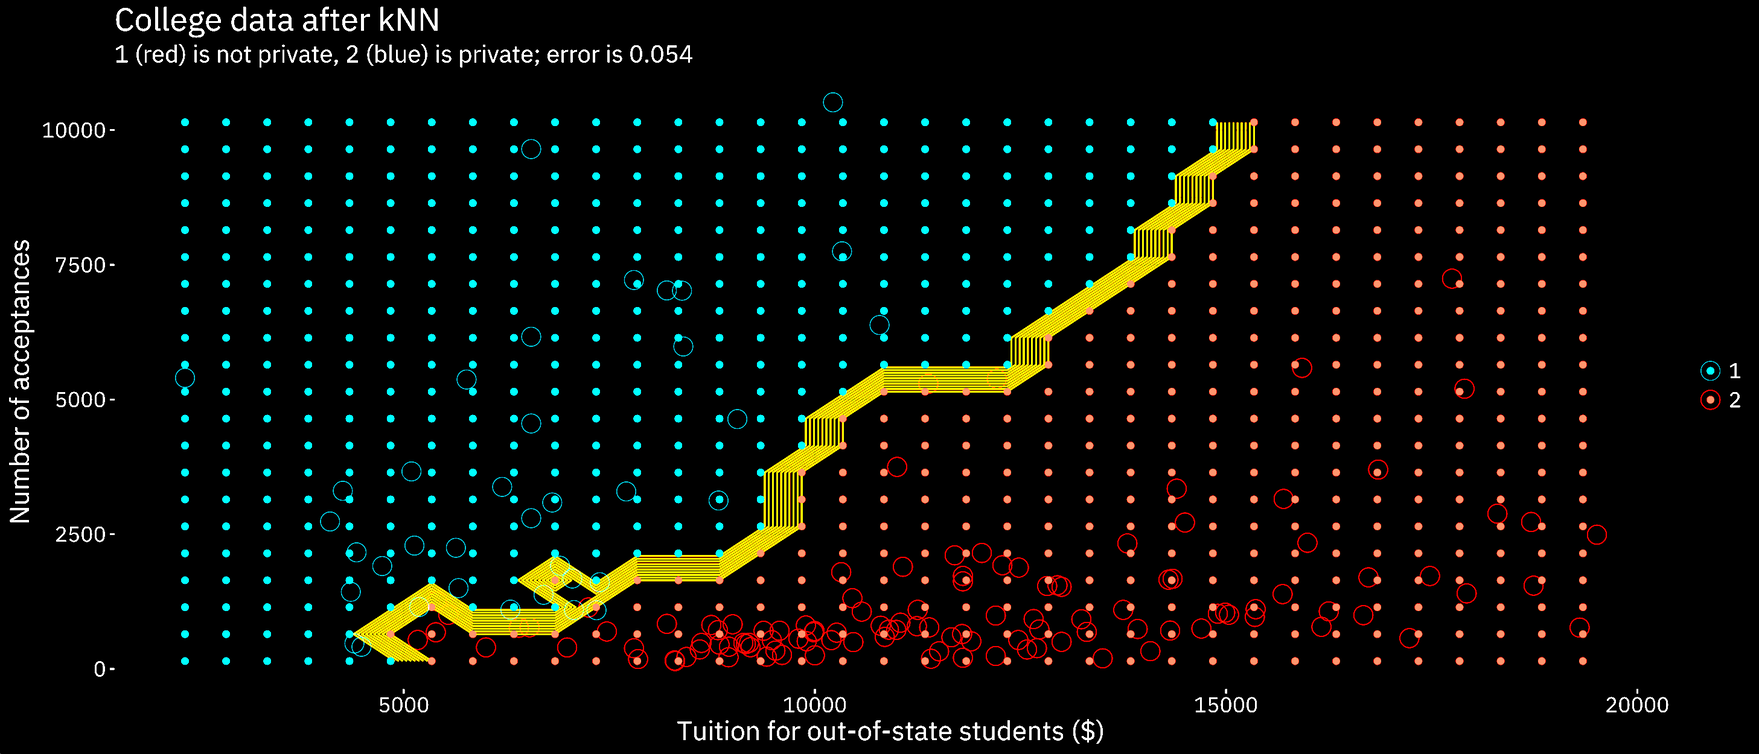
Conclusions↗
The decision tree was first used to determine the best predictor for our response variable. The tree showed that the out of state tuition (Outstate) was the best predictor for whether or not the college or university was private. This is consistent with the implications of the other classification methods specifically kNN. The kNN graphs with the lowest error all had out-of-state tuition as a explanatory variable, providing further evidence that ‘outstate’ is the best predictor for the response variable.
The best classification method was LDA using out of state tuition and enrollment as explanatory variables, with a training error of 0.093 (test error oddly of 0). This result was followed closely by kNN, which produced a respectable test error of 0.096. Decision trees were able to produce a model that had a cross-validated error of 0.198.
The effectiveness of these particular models is somewhat remarkable in retrospect, for both a model that depends upon a linearized trend line and a model that uses proximity-based determination produced very similar accuracy figures. However, the data was fairly separated to begin with, so this made for a particularly easier classification task.